Environmental Protection Air Policy 2008
It is important to note that QBH is located within an industrial area and that other local or regional sources may also contribute to any dust exceedances recorded or reported.
Monitoring locations surrounding the QBH facility
Dust Deposition
The following graphs summarise the monthly dust deposition data from January 2014 to May 2015.
 The dust deposition monitoring is conducted proactively for compliance purposes and is undertaken on a monthly basis and provides an average daily dust deposition rate for the previous month. QBH’s dust deposition monitoring campaign has run continuously since March 2013.
A coal fraction analysis of the monthly dust deposition samples is also undertaken to determine the contribution of sources of coal dust to the total dust deposition rate.
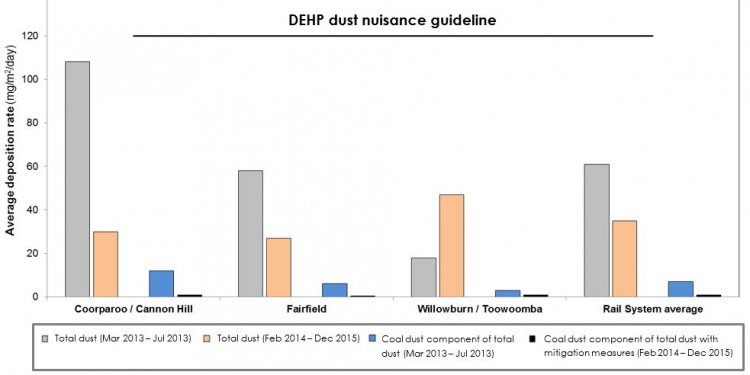
A level of 120 mg/m2/day for dust deposition, as specified by the Queensland Department of Environment and Health Protection, is shown on the graph as a guide to the status of compliance.
Click to enlarge image.
Key points from the compliance monitoring:
- Coal dust from QBH during 2015 is well below the compliance limit of 120 mg/m2/day and is less than 5 mg/m2/day at all monitoring sites.
- The dust deposition gauges at Sites 2, 3 and 4 are closest to local residential areas and show negligible coal dust (less than 5 mg/m2/day) and generally low levels of total dust deposited.
- Please note, there is a lag in the provision of the dust deposition monitoring results due to the laboratory time required for the dust compositional analysis, which is necessary to determine the coal content of each monthly sample collected.
- Importantly, QBH’s dust deposition monitoring continues to demonstrate that its coal handling operations are not causing significant impacts or dust nuisance off site, particularly in relation to the nearest sensitive receptors at Wynnum North.
Next phase:
QBH is continuing its compliance monitoring program for dust deposition, and to guarantee a high level of accuracy, has re-engaged the original independent air quality professional to undertake this specialised work.
QBH continues to consult with the Department of Environment and Heritage Protection and the community to ensure the compliance monitoring program for dust deposition is providing suitable data for scientific assessment purposes.
PM10 Particulates
The following graph summarises the PM10 particulate data for the period of September 2013 to November 2013. The 24 hour PM10 data was collected on a one-in-six day frequency during the targeted monitoring period and may be used for health impact evaluation purposes if a complaint is received.


